No account needed. This workspace belongs to this browser cookie, not a recoverable account. Clearing cookies, switching browsers or cookie expiry loses access. Download results before 24-hour dataset cleanup. Use the demo or non-sensitive data only. How data is handled.
python scripts/run_web.py, or start its worker separately.Understand your AnnData.
A matrix of measurements, with the information that gives each row and column meaning.
What is AnnData?
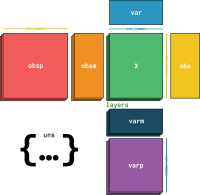
AnnData means annotated data. It keeps measurements and their metadata together. Observations might be cells or samples; variables (called features in this app) might be genes, proteins, or metabolites.
adata.X· Measurements- A numeric matrix: rows are observations, columns are features.
adata.obs· Observation metadata- One row per observation, aligned with X rows. Columns can describe treatment, subject, or batch.
adata.var· Feature metadata- One row per feature, aligned with X columns. Columns can hold gene symbols or feature annotations.
In the demo, X has 32 rows × 8 columns, obs has 32 rows, and var has 8 rows. Observation and feature identifiers keep these pieces aligned.
Other parts of the structure
layers- Additional matrices with the same shape as X, such as counts or transformed measurements.
obsmandvarm- Arrays aligned to observations or features, such as cell coordinates or gene loadings.
obspandvarp- Pairwise matrices between observations or between features, such as a neighbor graph.
uns- Unstructured metadata, such as analysis settings and color palettes.
raw- An optional saved X and its feature annotations. Its name does not guarantee unprocessed counts.
The studio uses X, a layer, or raw as its matrix source. Storing an embedding or graph does not mean every AnnData field has a dedicated GUI analysis.
From a dataset to your first result
Load or try a dataset
Open Datasets and choose Open demo dataset, or upload your own data. An
.h5adfile preserves additional AnnData fields. A CSV bundle creates X, obs, and var fromadata.X.csv,adata.obs.csv, andadata.var.csv.For CSVs, put row identifiers in the first column of each file. X row IDs must match obs row IDs, and X feature headers must match var row IDs. The app aligns metadata by these identifiers.
Inspect the structure
Use the Observations, Features, and Matrix previews. Check dimensions, identifiers, and group labels before analyzing. CSV metadata starts as text; use Metadata types in the studio when a column should be numeric.
Choose your measurements
In Analysis studio, select a Matrix source and features. The first three features are selected initially. Filters keep only the chosen observations. Check whether your selected matrix contains counts, normalized values, or transformed values before choosing a method.
Run a plot or statistical method
Start with Histogram and select Run analysis. To compare groups in the paired demo, choose a paired test with
conditionas the group column,ReferenceandTreatmentas the groups, andsubjectas the pairing column. Match the method to your study design.Statistical tests use your selected feature set for false discovery rate (FDR) correction. Changing that set can change adjusted p-values. Plots that require feature-level statistics use supplied or previously computed results.
Review and download
Open Results & downloads to inspect each run, check warnings, and download available figures, tables, settings, and reproduction scripts. Your source dataset stays unchanged. Download anything you want to keep before the workspace retention period ends.
Your data. A clearer view.
Explore annotated datasets, compare groups, and create scientific figures.
Load a dataset
Choose a file format to get started.
A small study.
A good place to start.
Try a synthetic paired study with treatment groups, subject IDs, and a transformed data layer.
Simulated data. No upload required.
COVID proteomics
Explore the repository’s full Olink study: 784 samples from 383 participants and 1,429 protein features. Measurements, missing values, and annotations are preserved.
Study and source citation · COVID codes: 0 = non-COVID, 1 = COVID. Values are supplied Olink NPX on a log2 scale; keep the plot axis linear.
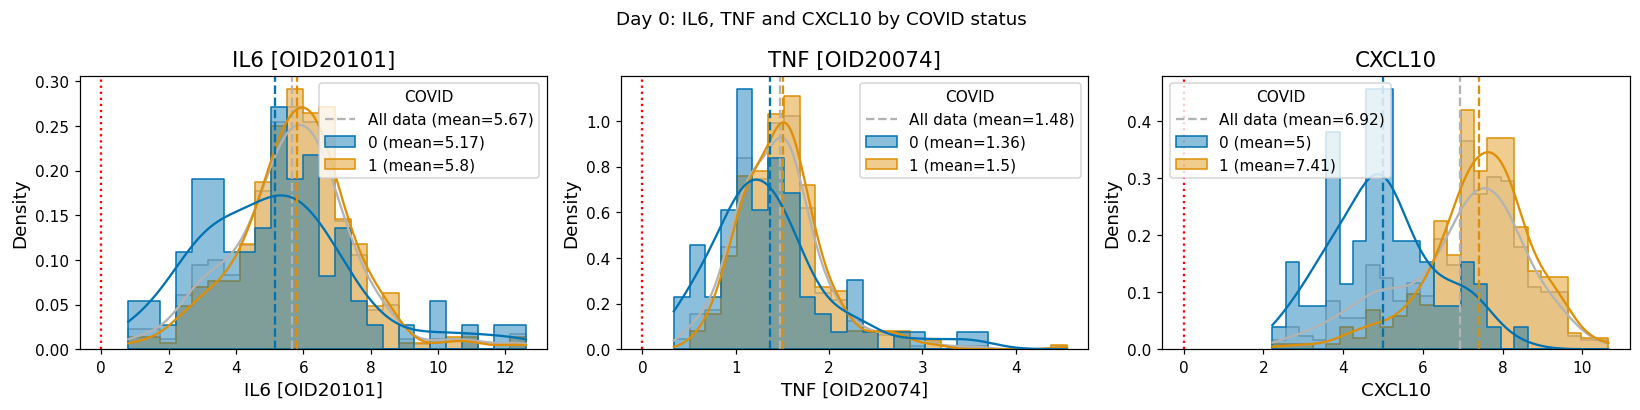
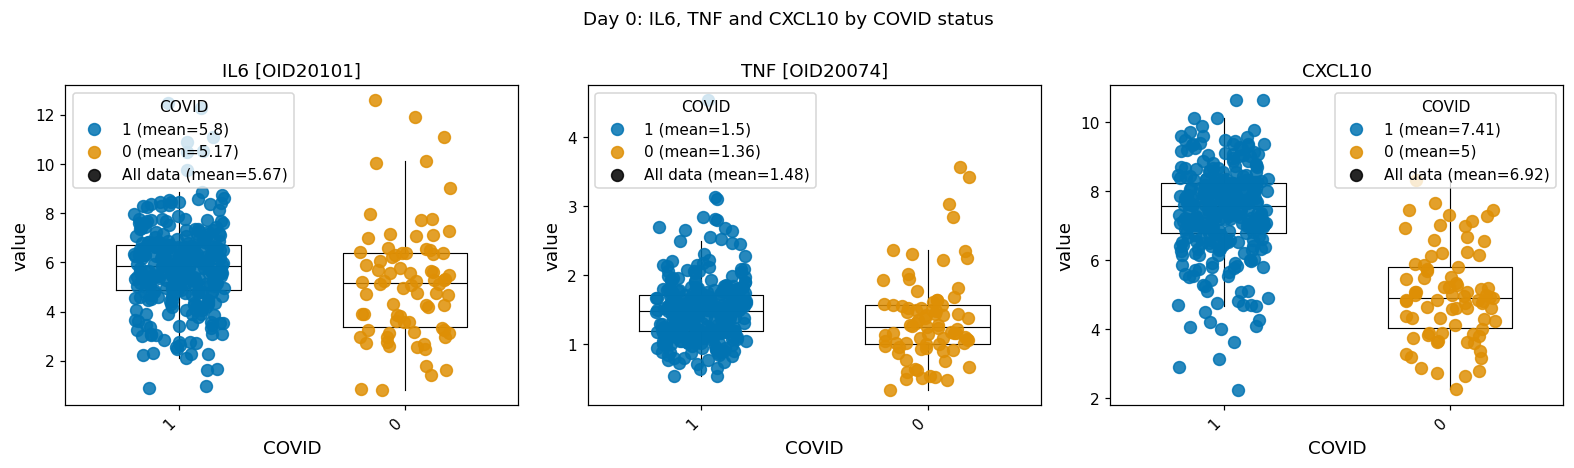
Previews use IL6 (OID20101), TNF (OID20074), and CXCL10 (OID20697), chosen as illustrative assays, not by significance. Download either the H5AD or all three CSV components. Open the COVID example to fill editable graph and pipeline settings; nothing runs automatically.
Try an example
Day-0 examples use one sample per participant. The visits pipeline shows descriptive distributions and means at days 0, 3, and 7, with repeated measurements and changing participant counts; it does not test independent groups or estimate paired changes. The full dataset remains available.
Dataset overview
Inspect your data
A bounded preview; the full dataset is used for your selected analysis.
Ask your next question.
Choose your data, configure a method, and run it explicitly.
Load a dataset to open the analysis studio.
See what your data says.
Every run keeps its own settings, outputs, and analysis record.
Run an analysis to see results here.
A workflow for your question.
Run a set of related analyses with one shared data selection.